
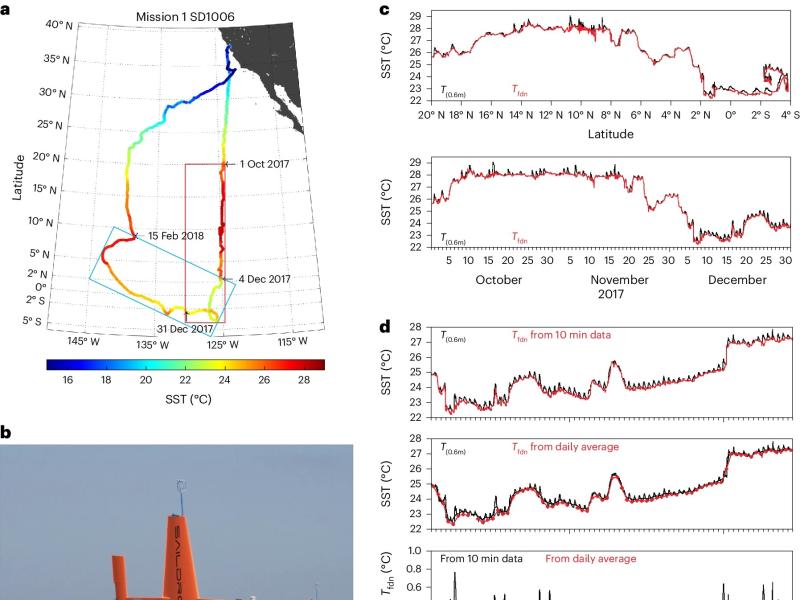
a, Saildrone #1006 (SD1006) track, coloured by SST measured at 0.6 m. b, TPOS Saildrone. c, Measured SST (black) and extrapolated foundation temperature (Tfdn) (red) for the period 1 October 2017 to 1 January 2018, when the drone was south of 20.23° N plotted as a latitude section along ~125° W (upper panel) and time series (lower panel). d, SST at 0.6 m (black) and extrapolated Tfdn (red) from 10 minute data (top panel) and from daily averaged data with 24 hour running-averaged SST shown in black (second panel). The third panel shows the difference between the SST at 0.6 m and Tfdn computed from 10 minute data (black solid), its 24 hour running average (black dashed) and that computed from daily averaged data (red). The bottom panel shows the daily high-passed SST at 0.6 m (black) and plus and minus values of the diurnal warm-layer effect at 0.6 m estimated from daily averaged data (red). Saildrone measurements and flux time series used in the Tfdn estimate are shown in Extended Data Figs. 1 and 2. Credit: b, Saildrone, Inc.
Credit: NOAA / Saildrone